Petra Hartmann · 2 November 2026
Weather Pattern Correlations Guiding Predictive Scheduling in Fruit Supply Chain Databases for Regional Growers
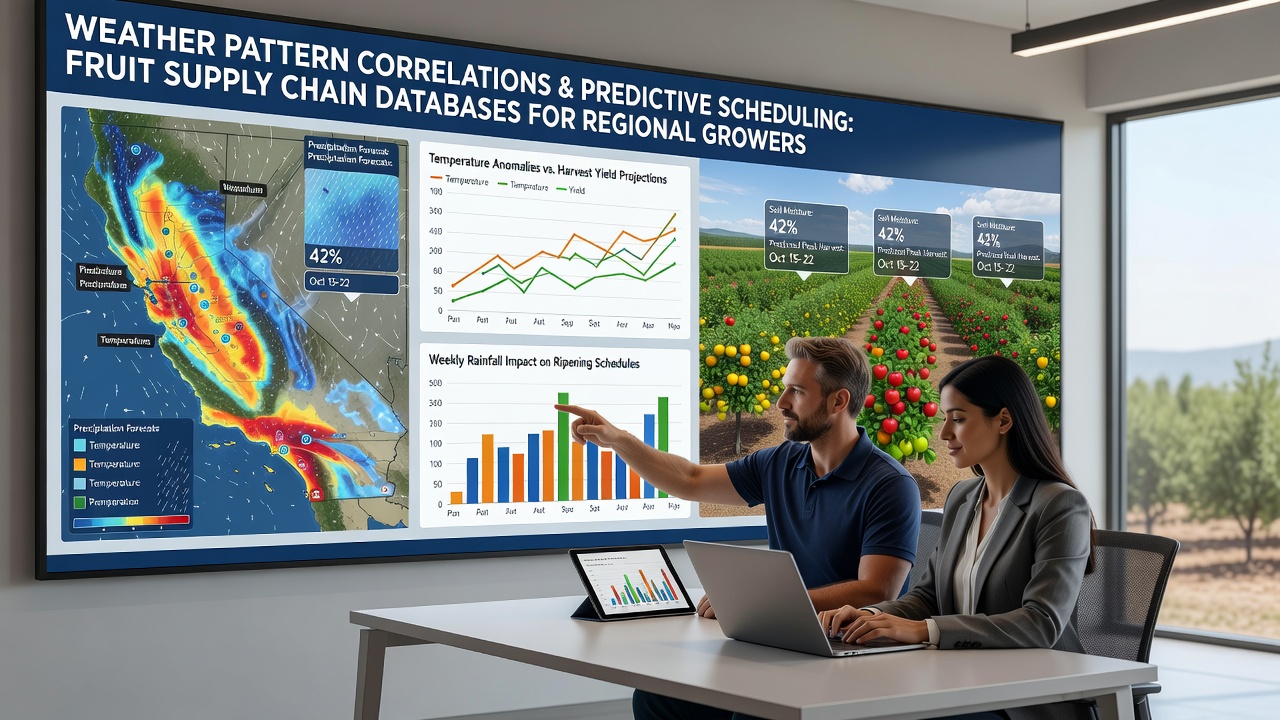
Regional growers have long tracked temperature shifts, rainfall totals, and wind patterns to time harvests, yet the scale of modern supply chains now requires databases that link these variables directly to logistics models. Correlations emerge when historical weather records align with yield volumes, transport delays, and market arrival windows, allowing algorithms to adjust planting schedules, picking crews, and cold-storage allocations weeks in advance. By November 2026, several regional networks across North America and Europe had already folded satellite-derived precipitation forecasts into their central planning systems, cutting last-minute rerouting costs for perishable loads.Building the Data Foundations
Weather stations positioned inside orchards feed hourly readings into grower-managed repositories, while national meteorological services supply broader atmospheric models that cover entire growing districts. Researchers at institutions such as the University of California’s Agricultural Issues Center have documented how combining on-site humidity spikes with regional frost warnings improves the accuracy of bloom-date predictions for stone-fruit varieties. These merged datasets then populate tables that flag periods when excess moisture coincides with peak labor demand, prompting earlier or later harvest windows to avoid spoilage.
Correlation Techniques in Practice
Statistical packages inside the databases calculate lag times between a heavy rain event and the resulting slowdown in truck departures from packing houses. One analysis of five years of Pacific Northwest apple shipments showed that a three-day stretch of temperatures above 28 °C during late August correlated with a 12 percent rise in bruising complaints upon arrival at distribution centers. Growers using these coefficients now pre-position extra padding materials and adjust refrigeration setpoints before the fruit leaves the farm gate. Similar work in Australia’s Murray-Darling Basin has tied wind-speed thresholds to increased evaporation rates that shorten the safe transport window for table grapes, prompting database rules that automatically extend cooling cycles when forecasts exceed 35 km/h for more than six hours.
Regional Implementation Examples
In the European Union, the Joint Research Centre maintains open weather-agriculture datasets that several Italian and Spanish citrus cooperatives import into their scheduling platforms. The system cross-references soil-moisture indices with port congestion statistics, so that when autumn storms are projected to delay Mediterranean sailings, harvest crews receive alerts to delay picking by 48 hours. Canadian prairie fruit producers, working through provincial agriculture ministries, have integrated Environment and Climate Change Canada radar data to anticipate hail events that threaten tender berry crops. When the probability exceeds 40 percent within a 72-hour window, the database triggers alternative market routing to processors who can accept damaged fruit for juice production.
Database Architecture and Predictive Triggers
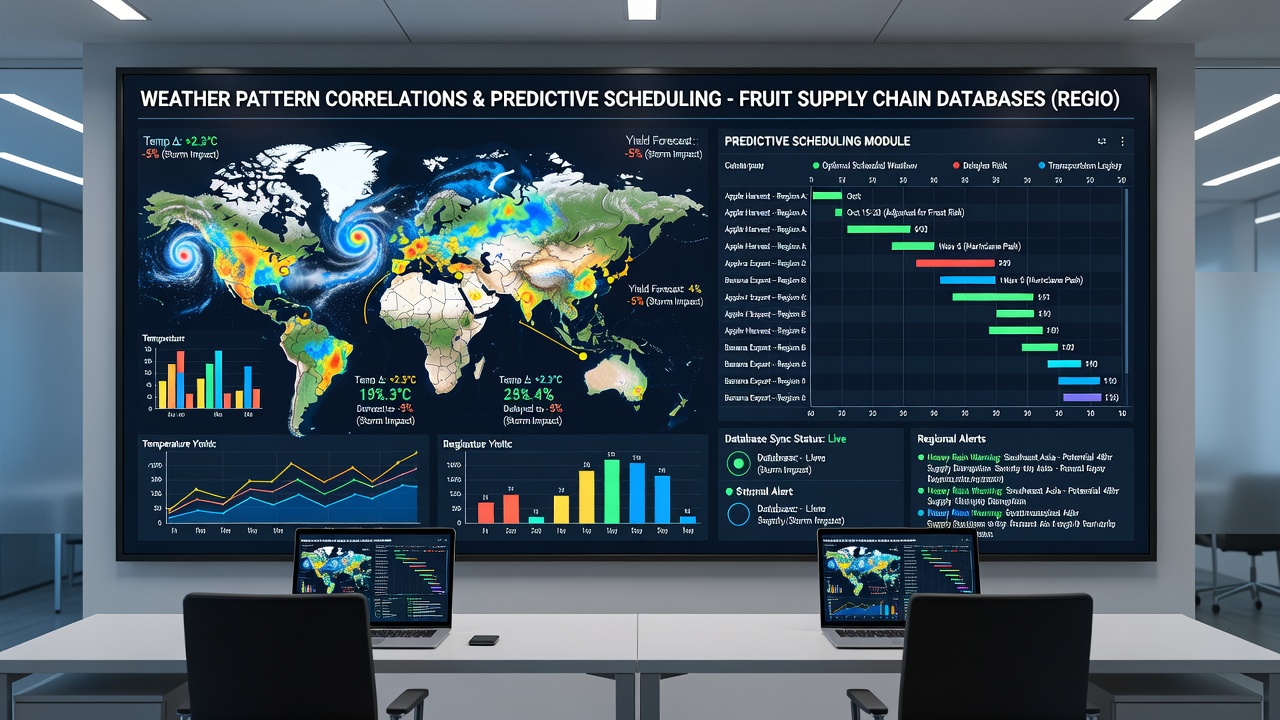
Modern platforms store weather variables in time-series columns that link to inventory, labor, and carrier records through standardized APIs. When a correlation engine detects that cumulative rainfall above 50 mm in seven days has historically extended ripening by four days for a given cultivar, it writes a new record that shifts the projected packing date and notifies contracted haulers. Queries run nightly so that any forecast update from the National Weather Service or the UK Met Office immediately recalculates downstream logistics. The architecture supports both batch uploads of historical seasons and real-time sensor streams, giving planners a rolling 30-day horizon that refreshes every six hours.
Challenges and Ongoing Refinements
Data gaps still appear in mountainous microclimates where station density remains low, and growers note that machine-learning models sometimes overfit to past drought years when new precipitation patterns emerge. Regional cooperatives therefore maintain validation teams that compare model outputs against actual bin counts and quality grades each season. Updates released in late 2026 incorporated additional variables such as dew-point duration and solar-radiation totals, which improved forecast skill scores for early-season strawberry scheduling in the southeastern United States.
Conclusion
Weather-pattern correlations embedded in fruit supply-chain databases now allow regional growers to move from reactive adjustments to scheduled operations that align harvest, packing, and transport with atmospheric conditions weeks ahead. Continued expansion of sensor networks and cross-border data sharing promises further gains in timing precision, provided that validation against field results remains a core part of system maintenance.